How to diagnose network issues using MTR (Traceroute)
Introduction
MTR (My traceroute) is a computer program which combines the functionality of the traceroute and ping programs in a single network diagnostic tool.
In this tutorial, we will install MTR program and discuss how to use and read MTR reports to diagnose network related issues.
Installing MTR program.
MTR tool is not installed on most systems by default. You can install MTR tool on your system by following the instructions for your operating system below.
Windows:
We need to download a program called WinMTR to take MTR reports on Windows.
Ubuntu:
We can use the Ubuntu apt-get package manager to install MTR by using the command below.
# sudo apt-get install mtr
CentOS:
Use the following command to install MTR on CentOS using yum package manager.
# yum install mtr
Taking an MTR report.
Windows:
We need to run WinMTR program by right clicking the WinMTR and "Run as administrator". The program that open should look like this:
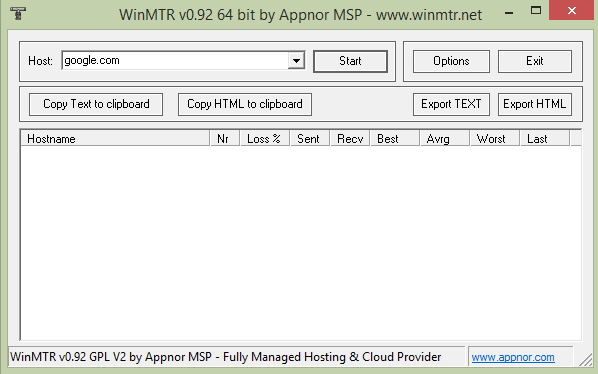
You can enter your IP address or the domain name and click the start button to run MTR to this host.
Ubuntu/CentOS:
You can use the command below to take an MTR report on Ubuntu/CentOS.
# mtr google.com
The output of the MTR report will be updated live, and you will be able to monitor the output. If you need to take a report of the MTR, you can add the argument --report to the command. This is useful if you need to send someone your MTR report, your ISP for example.
By default --report will output MTR report for ten cycles, you can change the number of report cycles by using --report-cycles as shown in the command below.
# mtr --report --report-cycles 20 google.com
Reading an MTR report.
Your MTR report should look similar to the following example from localhost to google.com.
# mtr --report google.com
HOST: node                         Loss%   Snt   Last   Avg  Best  Wrst StDev
  1.|-- ???                       100.0    10    0.0   0.0   0.0   0.0   0.0
  2.|-- xe-0-1-0-5.r00.lsanca19.u  0.0%    10    1.0   2.0   0.8   9.8   2.7
  3.|-- ae-17.r05.lsanca03.us.bb.  0.0%    10    1.0   1.5   1.0   3.4   0.6
  4.|-- ae-5.r21.lsanca03.us.bb.g  0.0%    10   31.1   8.7   0.6  31.1   8.8
  5.|-- ae-12.r22.snjsca04.us.bb.  0.0%    10   10.7  10.7  10.7  10.8   0.0
  6.|-- ae-36.r02.snjsca04.us.bb.  0.0%    10   14.3  14.2  14.0  14.3   0.0
  7.|-- eqixsjc-v6.google.com      0.0%    10   11.4  12.7  11.3  24.3   4.1
  8.|-- 2001:4860::1:0:7ea         0.0%    10   11.3  11.5  11.3  11.7   0.0
  9.|-- 2001:4860::8:0:8bb4        0.0%    10   11.9  12.1  11.8  14.0   0.5
 10.|-- 2001:4860::8:0:7a19        0.0%    10   11.5  12.7  11.4  15.6   1.4
 11.|-- 2001:4860::1:0:6b02        0.0%    10   11.7  12.0  11.7  12.7   0.0
 12.|-- 2001:4860:0:1::4f5         0.0%    10   11.6  11.5  11.5  11.6   0.0
 13.|-- lax17s05-in-x0e.1e100.net  0.0%    10   11.5  11.4  11.4  11.5   0.0
Now let's discuss how to read the MTR report that we took.
The first column (Hops) is the route packets took to reach the host, google.com in this case. Each one of the hops is a node or router on the internet packets went through.
Second column (Loss%) shows the percentage of packet loss at each hop.
Snt stands for sent and it means the amount of packets that was sent (report cycles).
Last, Avg, Best, Wrst are latency in milliseconds.
- Last - Latency of the last sent packet.
- Avg - Average latency all packets sent.
- Best - Best (shortest) latency to the host.
- Wrst - Worst (longest) latency to the host.
Lastly, the final column StDev is Standard deviation of the latencies to each host. You can use standard deviation to see if average (Avg) provided by the MTR report is accurate. The higher the standard deviation the greater the difference between best and worst latencies.


Comments
Add comment